|
|
In the previous chapter it was shown that the outcome of many decisions cannot be determined because of strategic situations. There are also situations which are necessarily risky. For example, we can never achieve 100 percent quarantine protection. We can never predict the weather past a few days; as a case in point the 1994-95 economic environment was very much influenced by a drought. When we start digging to build a road we're never quite sure what we're going to find.
This chapter deals with a means of modelling risky decisions, using decision trees, and concludes with some observations on attitudes to risk.
A typical problem we face is whether to do something with an assured benefit, or to
take a risk and do something with a possibly greater benefit, but also possibly a lesser
benefit. I have applied for two jobs; I have been offered one and must make a decision
today. On the other job, which I would like more, I won't hear till next week. I have a
small house and am throwing a party. Will I hold it outdoors, or will I hold it indoors in
case it rains?
Example - A Simple Choice Situation
A municipal electricity authority must decide whether to locate a power line on a one km route through a forest, or divert it around a plain for two km. The line costs $100 000 a km to build. The Bushfire Research Institute advises that if the forest route is chosen, then over the life of the line there is a 45 percent chance that the line would be caught in a catastrophic fire, which would require complete re-construction, and a 30 percent chance that a minor fire would preserve the towers but wreck the wires and insulators, which would cost $30 000 to repair. There is a 25 percent chance that there would be no fire at all.
We could present these probabilities in a table.
| Event | Payoff | Probability | Expected Value |
| Catastrophic fire | -100 000 | 0.45 | -45 000 |
| Minor fire | -30 000 | 0.30 | -9 000 |
| No fire | 0 | 0.25 | 0 |
| 1.00 | -54 000 |
In this table we have introduced two key concepts:
The payoff is expressed as a negative amount for each event. The expected value is simply the product of the payoff and the probability. We can see that the total expected value of taking the risk and building through the forest is $54 000, compared with $100 000 for building an extra kilometer of line. We choose the shorter route (and make sure we have negotiated access to funds in the event of a catastrophe).
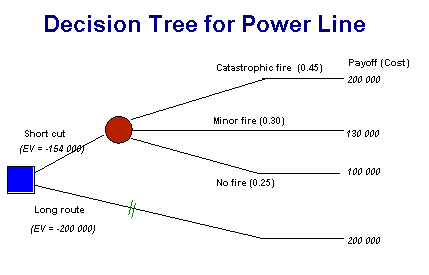
This sort of analysis can become complex, and an alternative means of modelling the problem is by means of a decision tree, as shown below.
Note we have included all costs on the payoff side of the tree - construction costs plus reconstruction costs if applicable. We have also introduced two more key concepts:
These are the key concepts in constructing a tree. Its benefit lies in the discipline it imposes - requiring us to structure the problem and to break it into manageable pieces. Decision analysis through use of decision trees forces us to think carefully about:

Using Decision Trees
Just as we summed the expected values in the table, so we can do likewise with a decision tree. This process is called folding back. In this case we reduce the chance node to an expected value, and are left with a simple choice. One way involves an expected value (negative) of $200 000; the other an expected value (negative) of $154 000. We can eliminate the more costly option, which we symbolize with a lopped branch (//) in the diagram. The basic rules for folding back are:
This looks simple. In this example it is, and there is no accompanying spreadsheet.. But we'll illustrate with a slightly more complex exercise how the solution moves away from an intuitively obvious one.
Example - More Complex Choice
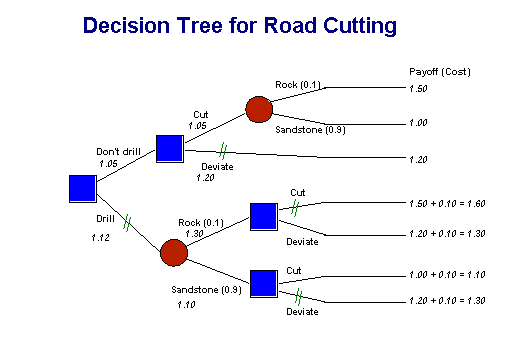
A road construction team is confronted by a hill, and they have three options:
(1) To cut through the hill and build the road. This would cost $1.5 million if the hill has conglomerate rocks, but only $1.0 million if the hill is predominantly sandstone.
(2) To build a deviation road around the hill. This would cost $1.2 million.
(3) To withhold a decision until having done an exploratory drill into the hill to see whether it's conglomerate or sandstone. This drilling would cost $0.1 million. The consequent cutting and construction costs would be unchanged.
The chief geologist is reasonably confident that there is a 90 percent chance that the hill is sandstone, and a 10 percent chance that the hill is conglomerate.

This exercise, besides showing use of a decision tree in a more complex situation, introduces the concept of the expected value of information - the value to us of getting extra information. In this we'd be willing to pay up to $30 000 to get the information, as can be seen by constructing the tree, substituting x for the $100 000 cost to drill, and seeing what value of x would exactly balance the two main branches. Unless we can get the information for $30 000 or less, our best bet is to go ahead without the information from the exploratory drill. The spreadsheet ch18ex01.xls shows how the tree can be constructed on a spreadsheet, and how the expected value of information can be obtained from a Goal Seek function. (This spreadsheet is a demonstration sheet only - for practice it's best to start with a big piece of paper.)
Decision Analysis in Investment Decisions
In investment decisions involving different outcomes over time we may need to combine decision analysis with discounting. We need to consider the NPVs of various options, some of which involve uncertainty. Again, an example will suffice to illustrate the methodology.
Imagine you have a job paying $40 000 a year, with an expected lump sum retirement benefit of $400 000. You are 25 years off retirement. An opportunity has come to take a bribe to influence a tender. If you are caught you lose your job and retirement benefit; you would get a laboring job paying $16 000 a year. You estimate the probability of detection at 35 percent. Assuming no interfering factors such as moral scruples, what is the minimum offer to make it worth taking the bribe? (A copy of the spreadsheet is at ch18ex02.xls).
All the foregoing assumes the decision maker is risk neutral. That is, he or she dispassionately weighs the payoffs by the probabilities to get the best expected value.
In fact, neither individuals nor institutional decision-makers exhibit such dispassionate risk neutrality. A full explanation of risk attitudes is beyond the scope of this work.(1)
The key concepts to be introduced in this section are:
A certainty equivalent establishes the certain value that would make a decision maker indifferent when deciding between an uncertain event and that certain value.
To illustrate this point, consider a game. You can win $500 on the toss of the coin. The expected value of that transaction is $250. That is a mathematically weighted probability (0.5 x $500 + 0.5 x $0). Your certainty equivalent amount may be $200 - you would as soon have a sure $200 as go on with the game. In that case you are risk averse. You may enjoy the game - you would have to be offered $300 to quit the game. In that case you are risk seeking - your certainty equivalent amount is greater than the expected value. Or you may accept only $250 but no less. In that case you are risk neutral.
As a general point decision makers are risk averse. Anyone who has observed government departments in day-to-day decision-making will appreciate that this generalization holds for institutions as well as flor individuals. But there are some important exceptions to this generalization, illustrated in the following exercises.
Exercises - Risk-averse and Risk-seeking Behavior
Think through the following exercises and write down your answers. Write what you would do, not what some idealized third party would do, before you read on.
1. You have a choice between a gift of $10 or a ticket in a lottery with 100 000 tickets and a single prize of $1 million. Which do you prefer?
2. In real life all lotteries are subject to tax, administration fees, retailers' commissions etc. Your option is between a gift of $10 and a ticket in a lottery with 125 000 tickets and a single prize of $1 million. Which do you prefer?
3. Great Aunt Clarabella has died, leaving you $50 000 in her will. The executor, who is honest but playful, offers you the full amount less a ten percent administration fee ($45 000), or, on the roll of a die, the chance of $300 000 if you win, nothing if you lose. There would be no administration charge on your winning.
The general approaches to these, and similar exercises, are that people typically approximate risk neutrality or even risk seeking behavior for small gambles. Many people will accept the lottery ticket in 2, even though its expected value is only $8 compared with a sure $10. This reflects either risk seeking behavior, or the perspective of the decision maker. If the question is framed as a "gift" of $10, then it will have less value than an "outlay" of $10.
People are typically risk averse, however, when it comes to large gambles Few people would accept the executor's gamble in the third case, even though it has a higher expected value than the $45 000.
People will often pay high premiums to buy complete certainty. This was pointed out in Chapter 10 on project choice-cost analysis. Consider, as a hypothetical example, two stock diseases:
Disease A, if it bypasses the quarantine net, would cause $1.0 billion damage to the cattle industry. Complete protection can be obtained for $1.0 million. A risk management approach, which leaves a 0.1 percent chance of breakout, would cost $0.5 million. If no risk reduction program is implemented the possibility of breakout is 0.3 percent.
Disease B is similar in terms of costs and risks.
If the government only has a budgetary allocation of $1.0 million, what should it do?
Cold analysis suggests that the $1.0 million should be spread across the two diseases. That would give an expected value of loss of $2.0 million (=2 * 0 .001*1 000 million). Allocating all the funds to one disease would give an expected value of loss of $3.0 million (=0 + 0.003*1 000 million). But in a political environment policy makers and even their clients may prefer the latter approach; that way they eliminate one area of risk entirely; it's better to have only one area of risk to contend with rather than two. (This is an example of pseudocertainty.) Those giving advice in such situations may have more chance of a rational response from decision makers if they point out that there is no such thing as certainty. Otherwise we run the risk of "Star Wars" protection in some areas, and complete exposure in others.
Specific References
1. For an excellent text on risk attitudes see Max Bazerman Judgement in Managerial Decision Making (Wiley 1986)